

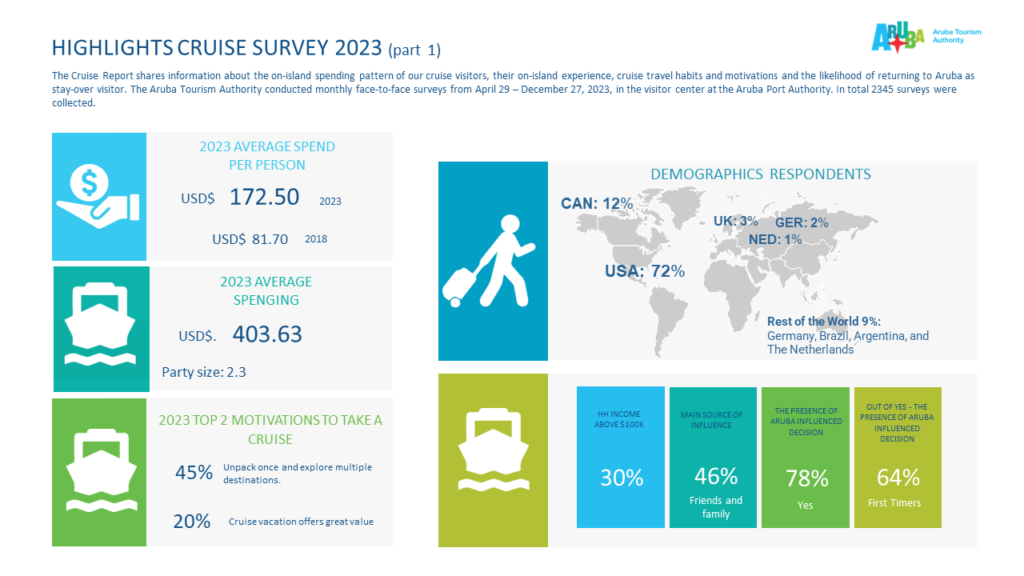
In 2023, the Aruba Tourism Authority (A.T.A.) surveyed 2345 cruise visitors at the A.T.A. Visitor Center located at the APA. Of the 2345 respondents, 72% indicated they stayed on the island for between 1 to 6 hours. While on the island, they spent an average of $172.50 per person, a 111% increase compared to a 2018 study where the average spending pattern was $81.70 per person.
Additionally, 30% of these visitors had an annual household income of over $100,000, with 6% earning more than $200,000. For more information, visit www.ata.aw for the full Cruise Spend 2023 study.
A.T.A. emphasizes the “High Value-Low Impact” model, which aims for a balance between the four pillars: ‘Quality of Life for Residents,’ ‘Quality of Experience for Visitors,’ ‘Protection and Preservation of Nature & Environment,’ and ‘Economic Contribution of the Tourism Sector.’
The goal is to maintain efforts in line with the aforementioned balance and to increase revenue proportionally more than the volume of visitors.
STAYOVER VOLUME INCREASES BY 19.2% IN APRIL 2024 COMPARED TO APRIL 2023
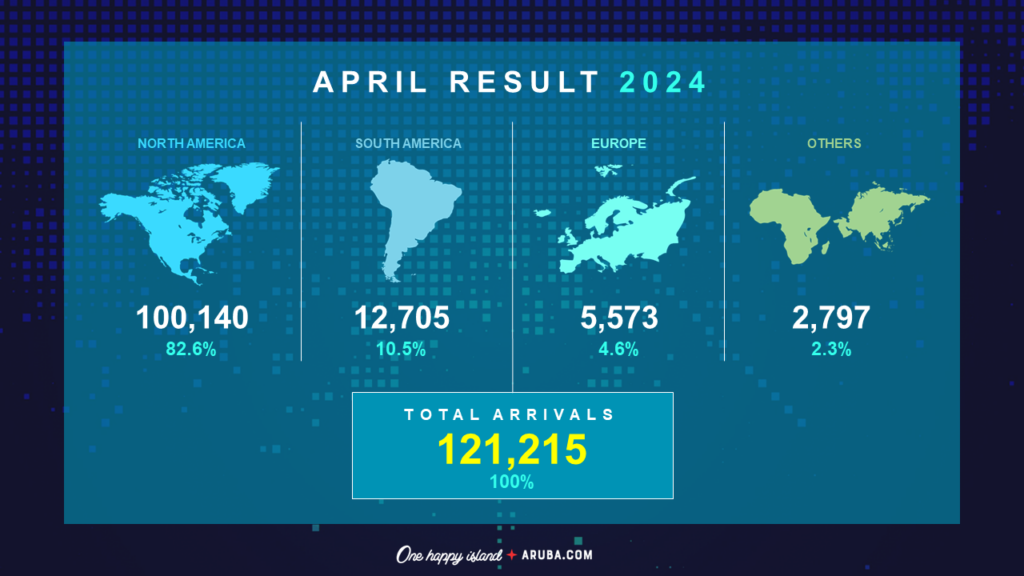
The demand for Aruba remains extremely high, consistently surpassing expectations. In line with this demand, airlines continue to expand capacity, allowing us to capture the demand. By April 2024, Aruba received a total of 121,215 stayover visitors, a growth of 9.7% compared to April 2023, with 110,476 stayover visitors.
AVERAGE SPENDING PATTERN PER STAYOVER VISITOR IN 2023
Visa credit card average spending per cardholder reached $690 in 2023. Overall, Visa’s revenue saw a growth of 13.8% compared to 2022.
MARKETS AND ACCOMMODATION CATEGORIES
In April 2024, 82.6% of the total stayover visitors to Aruba came from North America, 4.6% from Europe, 10.5% from Latin America, and 2.3% from other parts of the world.
Looking at accommodation categories in April 2024, 27.3% of visitors stayed in European Plan hotels, 15.1% in All-Inclusive hotels, 23.7% in Timeshares, and 33.9% in other types of accommodations, known as short-term vacation rentals (STVR).
SHORT-TERM VACATION RENTALS
A.T.A. has access to a platform that monitors the number of houses, apartments, and villas used as vacation rentals, as well as the average price per night, occupancy rates, and an estimate of the revenue generated. In 2023, according to a study, A.T.A. updated the inventory of existing condominiums and those under development, as well as a current list of non-hotel accommodations available for short-term tourists in Aruba.
| 2019 | 2020 | 2021 | 2022 | 2023 | 2024 | |
| Occupancy | 47% | 10% | 44% | 54% | 48% | 57% |
| Revenue | 5,291,957 | 1,513,999 | 7,736,854 | 12,501,137 | 15,886,106 | 20,155,958 |
| ADR | 169 | 201 | 208 | 235 | 255 | 294 |
Comparing April 2024 to April 2023, the average occupancy of these accommodations increased by 9%, from an average of 48% in April 2023 to 57% in April 2024.
In terms of revenue, comparing April 2023 to April 2024, this category saw a revenue growth of 26.9%.
By April 2024, Aruba received a total of 503,938 stayover visitors, a 19.2% increase compared to April 2023, when 422,835 stayover visitors were received. Market-wise, as of April 2024, 82.3% of visitors were from North America, 4.7% from Europe, 10.8% from Latin America, and 2.2% from other parts of the world.
Visit www.ata.aw to receive A.T.A.’s ‘Statistical Monthly Report’ every month. For more information or if you have any questions, contact Melanie Kelly at [email protected].


